Power BI Based Data Model, the Power BI Dataset
Source: Äri-IT Sügis 2021
Author: Koidu Kask, BI consultant at BCS Itera
The technical side of the Power BI can be left under the care of your IT partner.
How do I reduce the time spent on administering Power BI reports and share responsibilities if my organisation does not have enough resources, knowledge, or experience to do so?

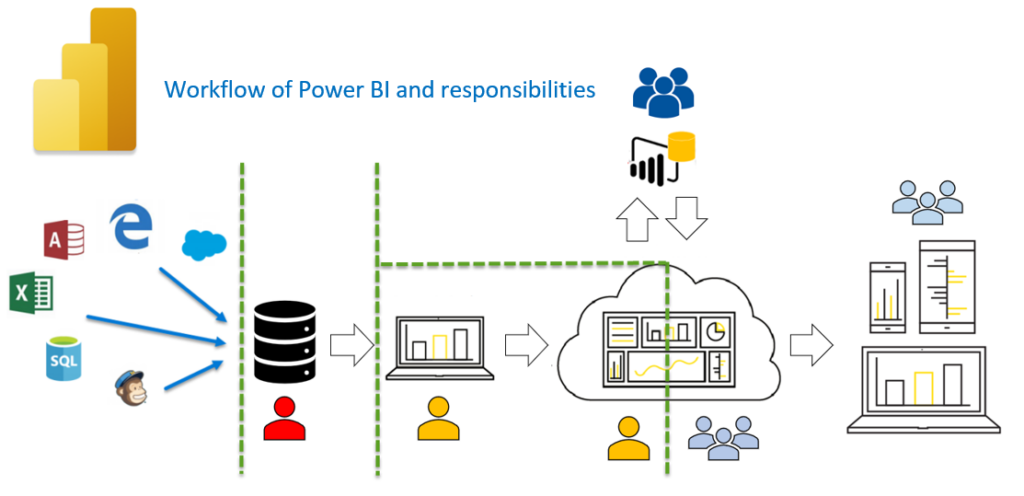
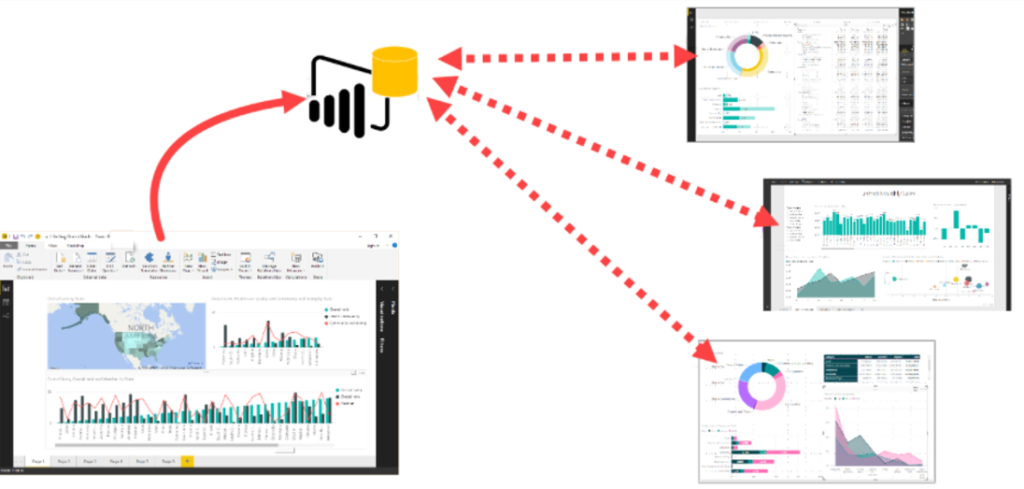
The Power BI service, which allows you to connect each new report set to an existing data model, has been created. This means that anything that concerns the more technical and, perhaps, more complex side of Power BI needs to be done only once. Also, thanks to the service, responsibility can be shared and the management of the model can be entrusted to your partner. The part of preparing a report that is related to the graphical presentation of data is simpler and easier to learn. This allows all participants to contribute according to their capabilities.
WHEN SHOULD YOU USE IT?
- When you find that the complexity and logic of data preparation is proving to be an obstacle.
- If various reports need to be prepared based on the same data, it reduces the number of report sheets.
- Controlled administration of the so-called golden model.
The preparation of data is usually difficult due to the large number of sources and table fields and the fact that the structure of systemic tables is not always understood. The question often arises as to which relationships, fields, and tables to combine with each other, in what direction, how to calculate metrics, etc.
To prevent the lack of knowledge and experience from becoming an obstacle to preparing a report, a central model enables you to define clear limits of responsibility.
Complexity of data preparation:
- many data sources
- different structures of data source tables
- data association
- adding additional data and conditions
- creating query/table relationships in a model
- creating metrics (DAX)
Specific stages are passed in the creation of the data model to ensure work quality and efficiency. To clarify, the same stages are used even when a central model is not used. The first step is to map the output, identify the required data and, along with this, data sources at the table fields level. Data are loaded into the application, cleaned, and processed.
The prepared set of data is loaded into the Power BI model side, where a date table is marked, relationships are created, and metrics are added. A distinctive feature of the central model is that visualised reports are not generally created in this file, but after adding metrics, the model is loaded into the corresponding workspace in the Power BI service. A schedule for updating data is also added in the service.
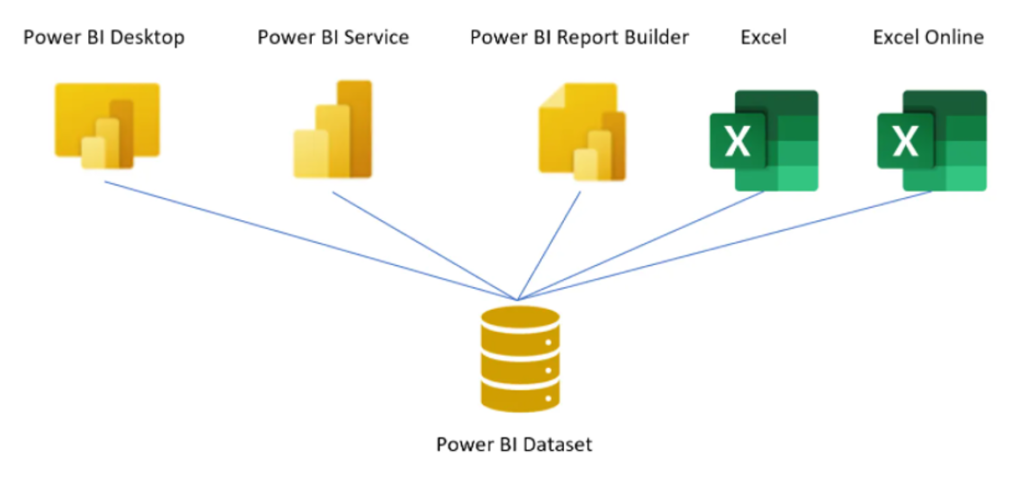
As soon as the model is released in the service, connections can be created for the model.
THE PROCESS OF CREATING A CENTRAL MODEL:
- data analysis
- data queries
- data transformation
- creating a model
- adding metrics
- releasing the model in the service (as it is called in the relevant functionality)
- adding an update schedule
- adding a change to the model
A live connection is created with a central model. This imposes certain restrictions on further data processing, but ensures the preservation of the original model. At the same time, it is possible to change the connection to direct, which allows you to add additional data and metrics. Changing the connection method does not affect the central model, but it does change the rules for updating a report in the Power BI service.
Connecting to a model directly in the Power BI service or in an Excel file does not allow you to change the connection method, i.e. the data are consumed in the form provided.
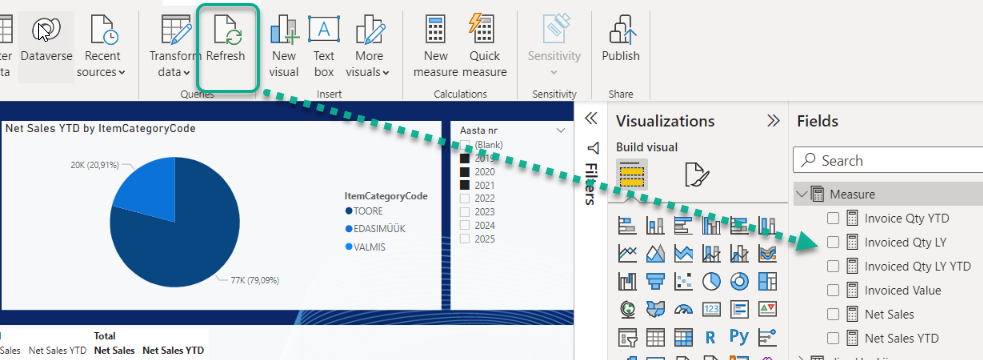
Changes made to the basic model—such as added data and metrics—are published in the Power BI web service each time. You can easily implement the changes in the report file connected to the model by clicking “Refresh”.
All changes and model and report sharing go through the Power BI Service and are associated with the same Office365 user.
The use of a central model greatly helps to get processes off the ground or manage reporting.
BCS Itera offers a variety of business analytics services and solutions, which can be viewed at https://www.itera.ee/en/product/.


