Reporting options using Microsoft Power BI
Source: Äri-IT, autumn 2022
Author: Koidu Kask, BI consultant at BCS Itera
Let’s look at the main opportunities and options in relation to and within the Power BI service.

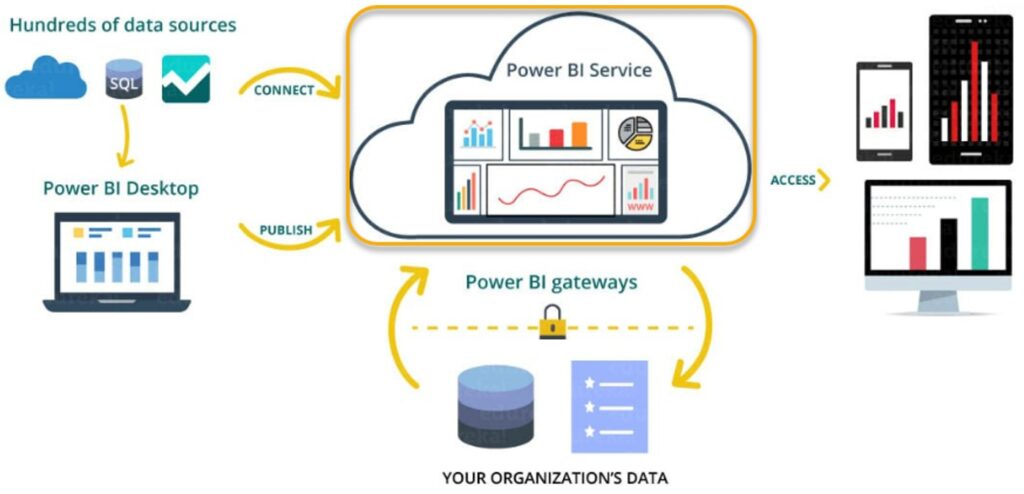
Microsoft’s Power BI reporting solution comes with a cloud service, the Power BI service. Powerful servers are running in the background that handle data volumes, loading, and also the transfer of reports to other applications, be it Excel, Teams, Business Central Role Centre, or a mobile app. All of these applications generally run on the corporate Office365 environment. Granted, there are volume restrictions and a choice between licences of different levels needs to be made, but this is typical of a service like this.
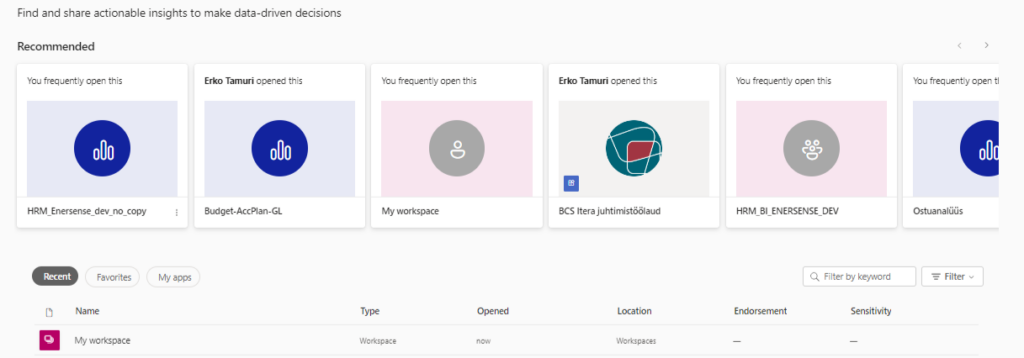
MICROSOFT POWER BI SERVICE PORTAL:
- to send reports to end users
- to automatically update data in reports
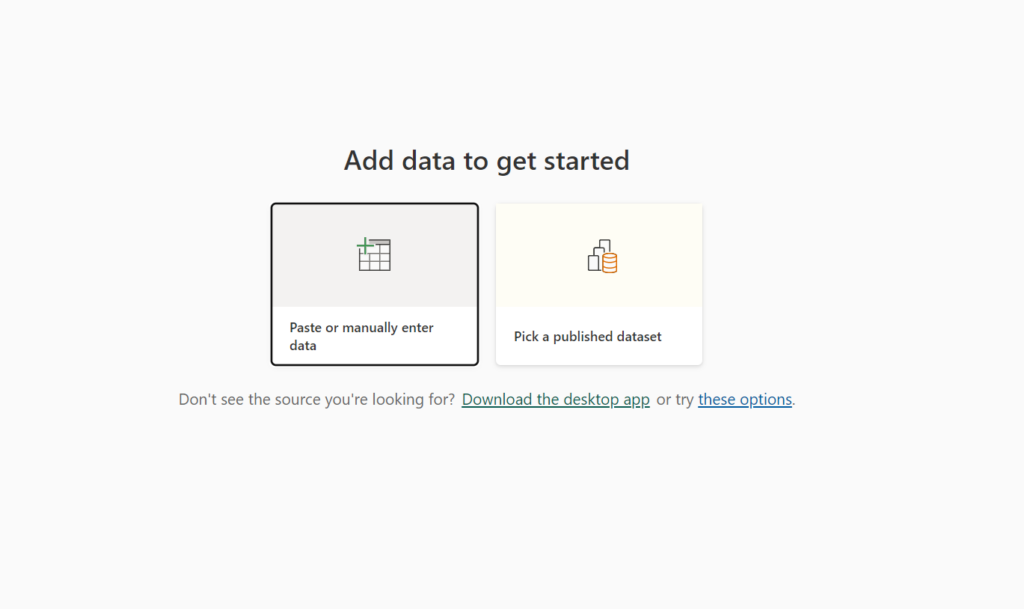
- to create reports on existing data sets
- to transfer reports and data to other applications
While the homepage of the service may seem very cluttered at first glance, don’t be dismayed: feel free to look around, experiment, read the pop-ups, and be sure to watch the introductory videos. If your role is that of a viewer of reports, you cannot break anything, but you can enhance your user experience.
Generally, the user will be provided with a link to an application in the reports workspace that will take them straight to the reports they need, and then it is important to find the options for displaying the reports.
APPLICATIONS RELATED TO THE SERVICE
- Teams
- Business Central
- Excel (Analysis in Excel)
- Outlook, the report will be sent to your inbox
- PowerPoint
– create a PowerPoint presentation
– add a live report to a PowerPoint slide
The service can also be used to share reports and data with other applications.
With the Teams app extension, reports made available in the service are available at the user’s fingertips. In Teams, you can use the menu to add either all reports or a specific report as the additional page of a working group’s channel. In Microsoft Business Central enterprise resource planning software, the Power BI service has been brought directly into the Role Centre. Reports can be opened in a new window while continuing to use the system in parallel, or you can view more detailed data and documents related to the report directly from the system. If the user’s day-to-day work is performed in Business Central, this is particularly convenient.
The Excel analysis functionality allows the user to view the data model data in tabular form for more detailed analysis when a graphical view is not sufficient.
The service itself also includes the possibility to create new views and reports based on already existing data models.
Those who do not need to create reports themselves or cannot or do not want to use Teams and Business Central can have reports with a preview of the updated data and a link delivered to their mailbox at a specific time. Each user can subscribe to the service by subscribing to reports for either every morning or several times a day. Internally, the subscription can also be created by the workspace administrator for the user.
POWERPOINT SLIDES
Converting report sheets to PowerPoint slides means that the presenter does not have to keep switching to another application, but can display the reports immediately. Reports can be displayed as an image, but the user can also add an interactive report to a PowerPoint slide.
REPORT PAGE FUNCTIONALITIES
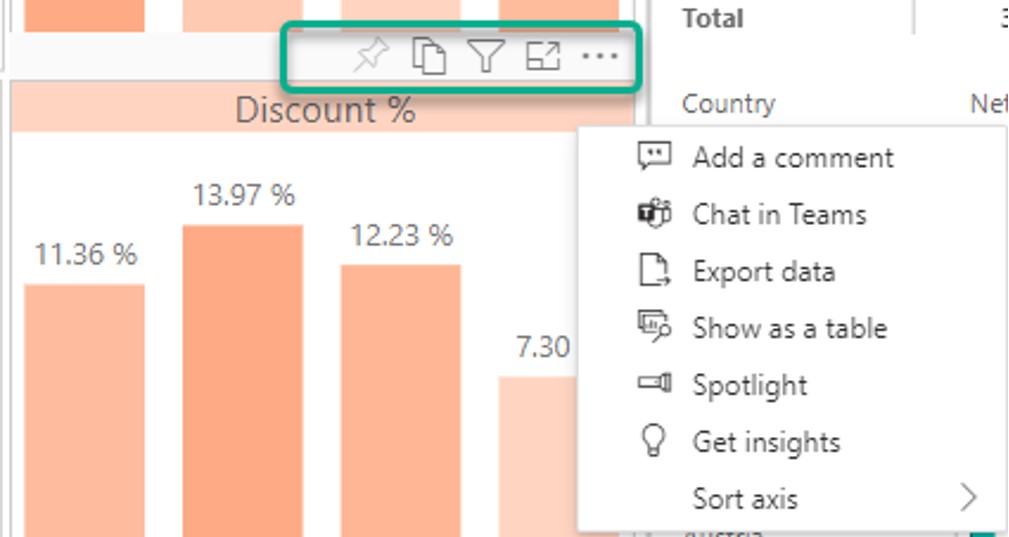
The report page may seem like one whole entity at first, but it is generally made up of a number of different visuals. Hovering or clicking around the report page will bring up additional windows, such as tooltips added to the report, filter information related to the visuals, or additional navigation options.
Separate filters can be set for each visual, according to the data presentation needs. Depending on the nature of the report, the filtering option can also be locked or disabled. The latter is necessary to avoid a situation where users have a different number of filters for the same thing. You can find out which filters have been applied to a particular visual by clicking on the ‘funnel’ in the header. It also has focus mode, which is useful when not all the information is displayed sufficiently clearly and a wider picture is helpful.
Useful functionalities in the service:
- focus mode
- go deeper
- add your own bookmarks
- filter
- exchange comments with other users
- restore default settings
- change the view
- sort by column in a tabular report
- etc.
If different users within the same report need to display data across multiple dimensions (for example, a department dimension), each user can add their own personal bookmark and save it as a default view. This means that filters do not have to be constantly reselected.
It is not always possible to add all dimensions as a separate filter block, as then there would be no more space for graphs. It is worth remembering that the visuals for each category can also be used as a filter simply by clicking on them. If you end up with too many filters, you always have the option to restore default settings.
It is also worth noting, for example, the +/- signs or arrows – these are all additional functionalities for better data analysis, navigation, and sorting.
The service has so many other possibilities that they cannot all be described or used at once. Power BI is here to stay and is constantly evolving. The more we get involved, the more we know.


